Living Planet Index


Threats
Drivers of declines in the Living Planet Database
In addition to abundance change data, information about the monitoring location, and different aspects of the ecology or management of the species are recorded for each population in the LPD. This includes local threats affecting each population where this information is available from the data source. Drivers of decline affecting LPI populations globally or at smaller spatial scales can then be examined in more detail, for example for the Living Planet Report where different patterns of threats are affecting taxa in different IPBES regions (WWF 2026).
While habitat loss and degradation, and exploitation, are the most frequently cited local threats affecting populations in the LPD, a global analysis highlighted that the steepest declines are associated with disease, invasive species, pollution, and climate change (Capdevila et al. 2026). In addition, the presence of multiple threats contributes more to declines than variations in space or time. Taken together, these findings not only suggest the need to focus on all types of threats, but that halting vertebrate biodiversity loss requires tackling multiple drivers of decline at the same time.
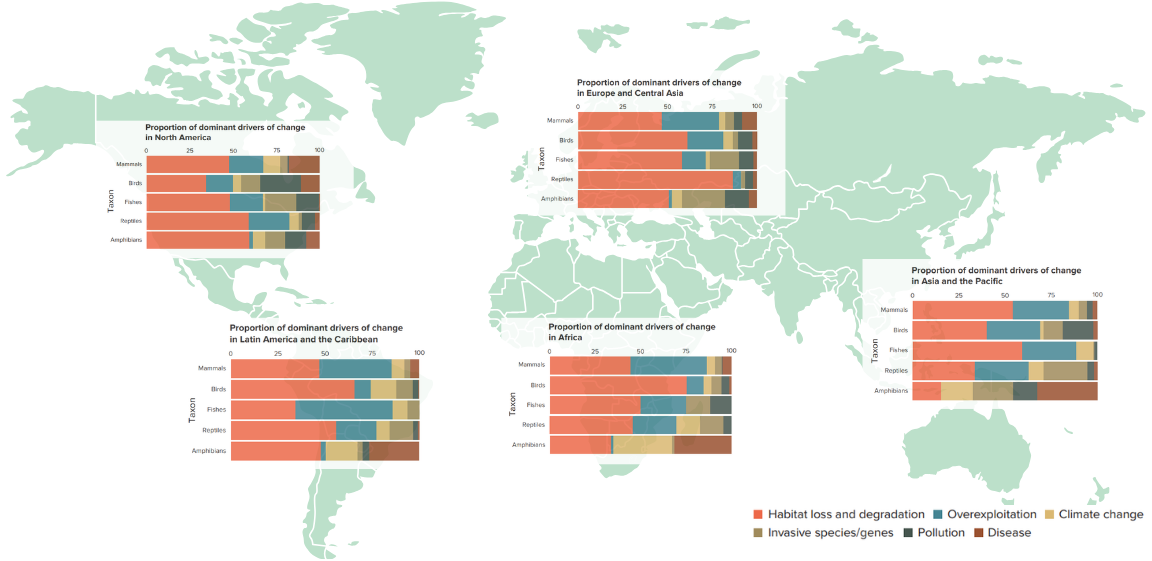
Figure 1: The proportion of dominant threats cited for a total of 3,116 populations in the Living Planet Database across the different IPBES regions (WWF 2026).
Canadian cumulative threats
There are also differences in the main drivers of decline for species in different habitats. In Canada, for example, spatially explicit high-intensity cumulative threats (HICTs) available from sources other than the LPD, diverged in marine and terrestrial populations (Currie et al. 2025). Terrestrial vertebrate populations often coincided spatially with proximity to humans, infrastructure, and land cover change, while marine populations commonly overlapped with shipping, exploitation, and pollution pressures. There were significant negative associations between monitored population trends and both HICTs and the number of habitats occupied by the species in question. However, the proportion of variance that threats and habitats could confidently explain is limited, so there are other important predictors to be discovered in future work.
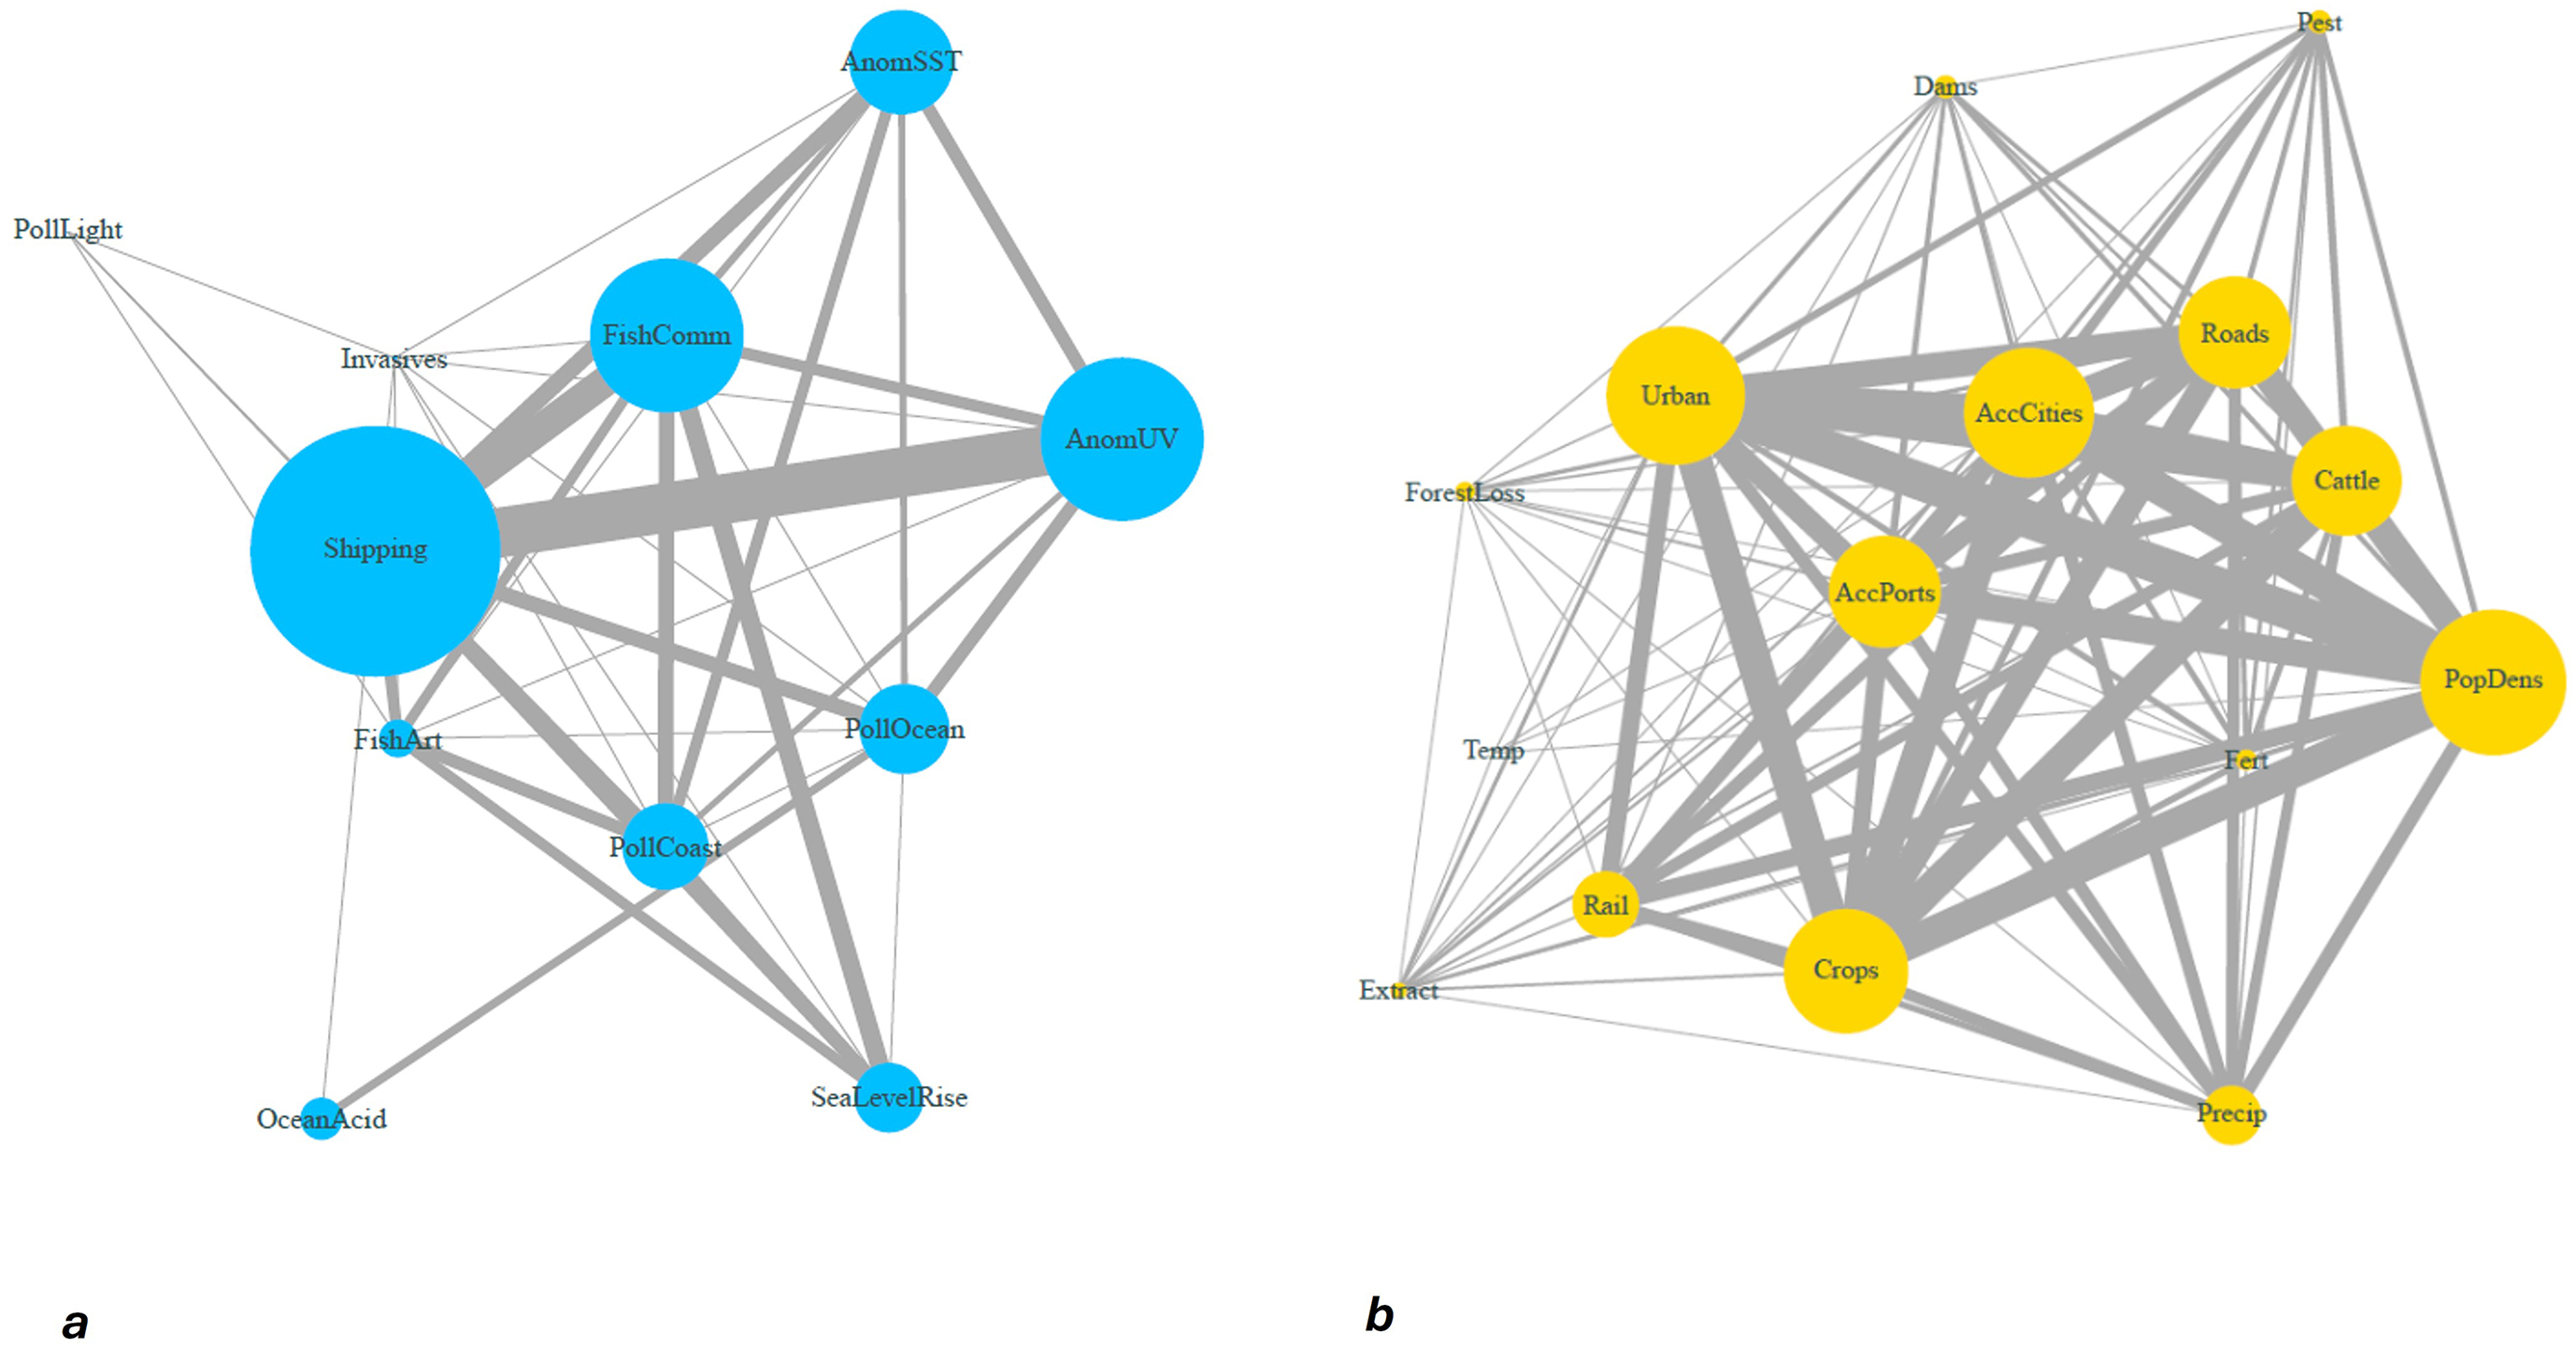
Figure 2. Networks of high-intensity cumulative threats of a) marine (1379 populations of 256 species) and b) Terrestrial/ freshwater realms (97,327 populations of 605 species) in Canada. The side of the nodes is proportional to the frequency of the threat and the width of the links if proportional to the frequency of two threats co-occurring. Figure from Currie et al. 2025.
The use and trade of wildlife
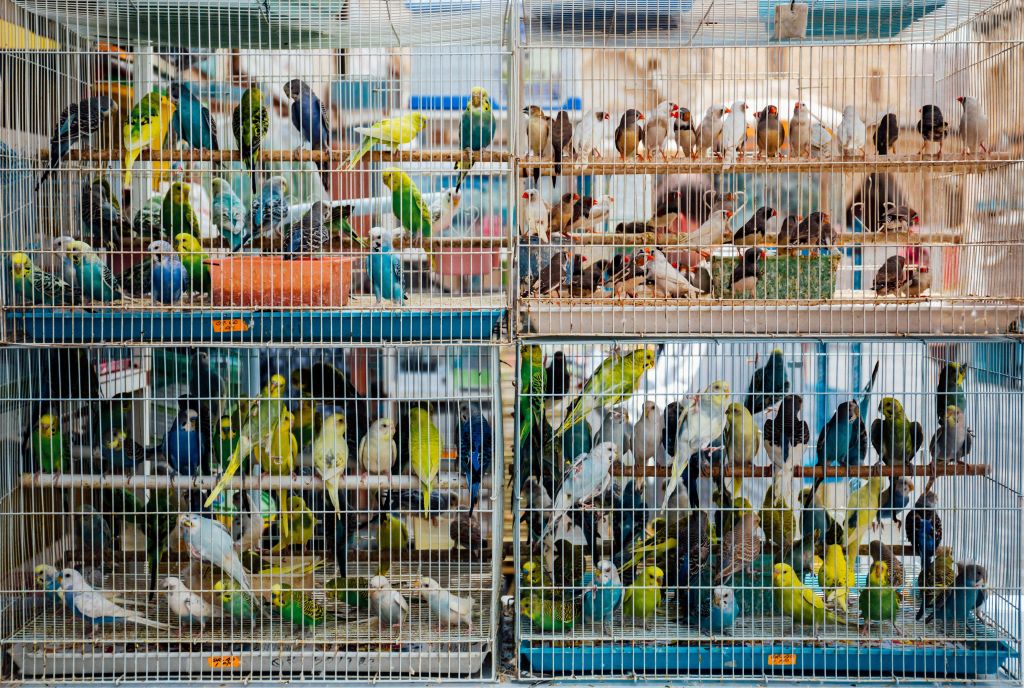
One specific threat under investigation is the impact of use and trade on wildlife, and we are involved in a project developing indicators for species in use and trade. The utilisation of species by people does not automatically confer a negative impact if that use is sustainable. Previous research using the LPI highlighted that when targeted management is in place, populations showed less negative or increasing trends overall.
While the impact of illegal trade in wildlife has increasingly become a priority in research and conservation, it is not the only type of environmental crime affecting species. To date, little research has been undertaken to understand the historical and possible future impacts of other types of crime on biodiversity globally, including deforestation and forest crime, land grabbing and encroachment, illegal mining and extractive activities illegal and unreported fishing, pollution and waste crime, and climate-related crimes, among others. In a collaborative project with WWF UK, we are starting to explore this important topic to see if the LPI data can be used to understand impacts of these different types of pressure.