About the index
- What kind of data? |
- What does the LPI indicate? |
- Are all populations in the LPI declining? |
- How are short time-series distributed across taxonomic groups?
What kind of data?
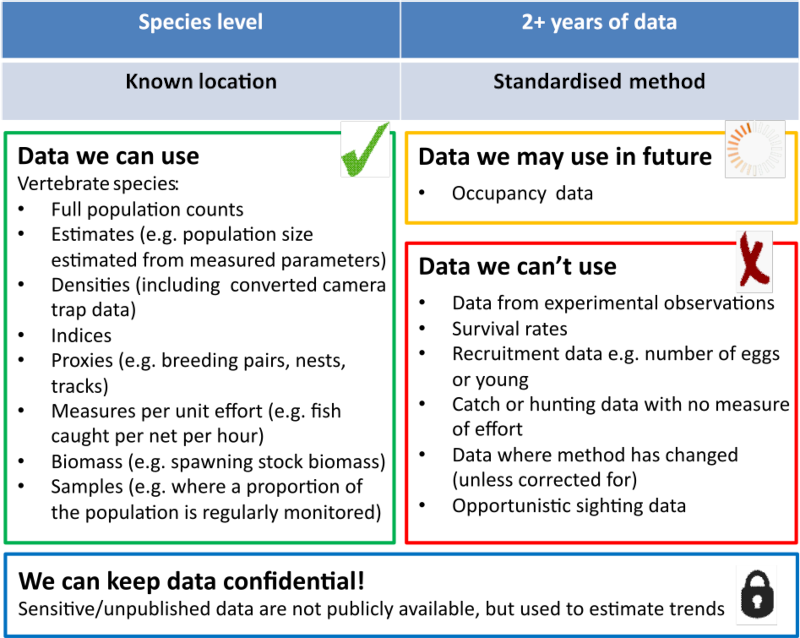
The data used in constructing the LPI are time-series of either population size, density (population size per unit area), abundance (number of individuals per sample) or a proxy of abundance (for example, the number of nests recorded may be used instead of a direct population count). The table below gives you an idea of what can and can’t be used.

If you have data you would like to contribute to the Living Planet Database, please get in touch with us at LivingPlanetIndex (at) ioz.ac.uk.
What does the LPI indicate?
The headline trend from this Living Planet Report is that globally, monitored populations of birds, mammals, fish, reptiles and amphibians have declined in abundance by 73% on average between 1970 and 2020. But what does this actually mean? Below is a table of what the LPI is and what the common misconceptions are.
| Features of the LPI | Common misconceptions |
|---|---|
| The LPI indicates the average rate of change in animal population sizes of native species | The LPI doesn’t show numbers of individuals lost or extinctions, although some populations do decline to local extinction |
| Species and populations in the LPI show increasing, declining and stable trends | A declining global LPI doesn’t mean that all species and populations are in decline |
| About half of the species we have in the LPI show an average decline in population trend | The LPI statistic does not mean that the same proportion of all species or populations worldwide are in decline, nor that the same number of populations or individual animals have been lost |
| The LPI includes data for threatened and non-threatened species – if a species is monitored consistently over time, it is included in the dataset | The species in the LPI are not selected based on whether they are under threat, but on whether there is robust population trend data available |
Are all populations in the LPI declining?
LPI results are calculations of average trends. This means that for the global LPI some populations and species are faring worse than a 73% decline whereas others are not declining as much or are increasing. Just over half of amphibian, bird and fish populations show a declining trend. Conversely, just over half of mammal and reptile populations are stable or increasing.
As the number of populations that have positive and negative trends are more or less equal, this means that the magnitude of the declining trends exceeds that of the increasing trends in order to result in an average decline for the global LPI. Also, the location of declining populations will determine how much weight they are attributed in the global index.
How are short time-series distributed across taxonomic groups?
The LPI database contains data gathered from different sources and collected at different scales, and not explicitly for the purpose of the analyses presented in the Living Planet Report. It therefore consists of time series of varying lengths (interval between the first and the last observation) and fullness (number of observations over the total number of years). For some species/groups, however, only shorter time-series are available, as shown in the figure below. Whilst time series for birds, mammals and fish are longer, amphibians are almost exclusively represented in the database by shorter time-series. Long-term data are often available for species/groups that are doing better on the whole. We gather all available data in order to detect trends that might be important from a conservation perspective.

