Living Planet Index


Data Bias
Exploring bias in the Living Planet Database
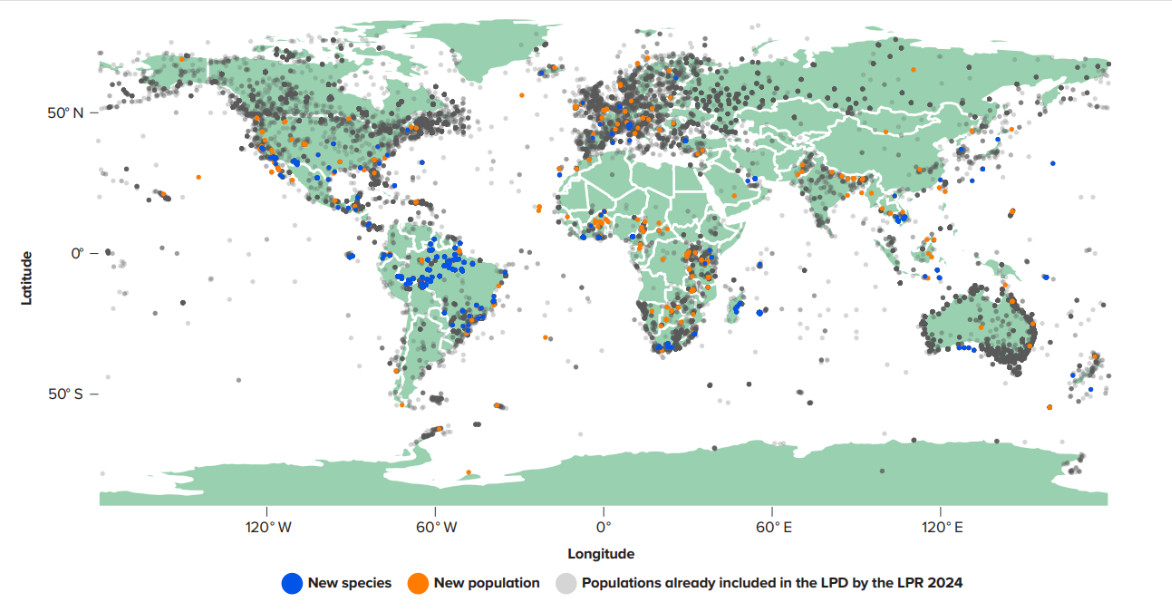
Biodiversity isn’t systematically monitored across the world, meaning large databases are almost always aggregations of many smaller studies, and the Living Planet Database is no exception. As a result, the data in it are biased towards well-studied species groups and regions. Species that are charismatic, threatened or easier to observe are better represented. There are more data from regions with a longer history of monitoring and publishing, such as North America and Europe. Larger gaps tend to be in more remote, tropical areas.
Similarly, data is not evenly distributed across the time period the LPI focusses on (1970 to the present day), with less data available for the earlier decades (due to many monitoring programmes starting later than 1970) and for the most recent years (due to the time it takes to collect, process and publish monitoring data). The duration of the time-series included in the database also varies. Often, populations are monitored for short time periods because a project ends, the funding for the monitoring runs out, or the survey location becomes unsuitable for monitoring (for example due to external factors such as conflict, or changes to the land from infrastructure development). Finally, reflective of both the dominance of English in scientific literature and the languages spoken by the team, the index is also dominated by data from sources in English, which risks exacerbating existing geographic biases and limiting the representativeness of the index.
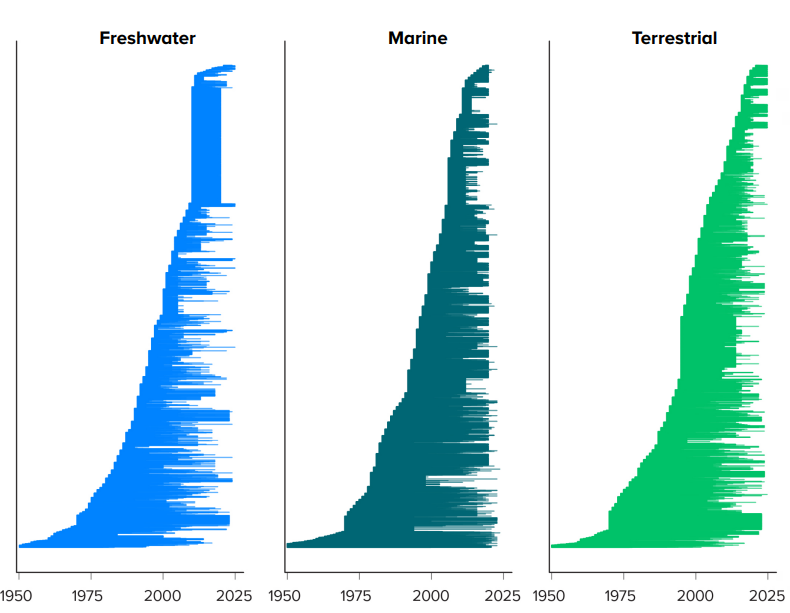
The graph above shows the temporal coverage of Living Planet Database population time-series between 1950 and 2025. Each horizontal line represents a population time-series from its first year of monitoring to the last year. Populations are ordered by the first year of monitoring. Updated from Oppenheimer et al. (2026).
Disaggregating the data in different ways helps us show more transparently how much data are available for different regions and taxonomic groups. For example, in the Living Planet Report, trends for each of the IPBES regions are presented alongside the global LPI. Each time a Living Planet Report is produced, representation is assessed and discussed in the accompanying technical report for transparency. Representation is also investigated through targeted analyses, both regionally (Currie et al., 2022) and globally (Oppenheimer et al., 2026).
Mitigating bias in the Living Planet Database
One way we try to address the bias in the database is to collect more data and continue to improve the taxonomic and geographic coverage of the dataset. Data searches are ongoing, and the database is continuously augmented, particularly for taxa and regions that are underrepresented according to the gap analysis that is carried out by the team on a regular basis. The representation of tropical species has been growing over the past few reports through targeted data searches. Searching data available in languages other than English or published in more local journals also allows the team to boost representation for country where English is not widely spoken. For example, the collaboration with in-country researchers collecting data in Portuguese has continued to help rapidly expand the dataset for Brazil, as it did for previous reports. There is also evidence that local journals contain data from different locations within the same country compared to international journals (Serrano et al., 2025). Future data searches would therefore benefit from closer collaboration with research groups and institutions within under-represented regions or countries to expand geographic coverage by tapping into local publications.
Supporting institutions developing or producing national or regional-level indicators has also been helpful to enrich the database, as in-country partners have knowledge of or access to local resources.
Non-vertebrate species data
While the LPI is primarily an indicator based on vertebrate species data, the LPD contains some data on butterflies and plants. The LPI team is working with the Global Butterfly Monitoring Network to augment these datasets and to develop indicators based on them (Riva et al. 2026). Despite efforts to improve data representation, gaps remain in the dataset. The challenge, therefore, is to represent all described vertebrate species using only those for which data are available. In 2014, we made the choice to mitigate the remaining bias in the dataset, thus making the indicator more representative of vertebrate biodiversity, by incorporating weightings into the methodology to account for the estimated diversity of species globally (McRae et al., 2017).