Estuaries
As one of the most productive and diverse ecosystems in the world, estuaries provide a range of habitats for a variety of species, important ecosystem services and protection against the oceans. Despite their utmost importance to humans, estuarine systems are amongst the most modified and threatened ecosystems in the world, suffering from anthropogenic impacts that interfere with both the riverine and marine influences necessary for natural ecological functioning.

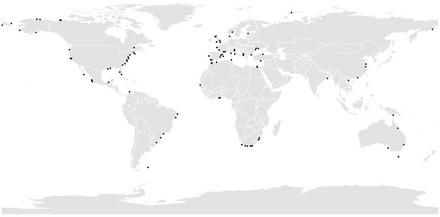
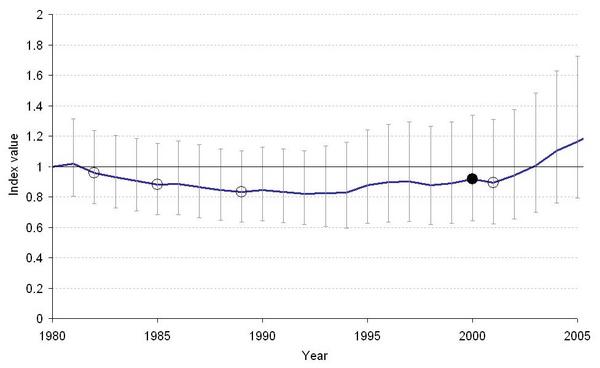
The aim of this project was to assess how biodiversity has changed in estuaries from 1980 and whether any identifiable trend can be related to extrinsic, anthropogenic threats (e.g. man-made interventions), or other factors such as estuary type or drivers of change. The estuarine index was based on abundance information from 1,224 populations of 500 vertebrate species from 110 estuarine locations around the world (Figure 1).

There was some evidence for the detrimental effects of anthropogenic changes: dams and water extraction are associated with a decrease in estuarine abundance, and wildlife populations from areas of high human population density show a higher rate of loss than those from areas of low human population density, mediated by a regional effect, with tropical abundance decreasing and temperate abundance increasing.
Figure 1. The distribution of 110 estuaries in the analysis.

This analysis represents an initial review of the potential for trends in vertebrate population abundance to inform the status and trends of biodiversity in estuarine systems. Due to restricted sample sizes and taxonomic and regional inequalities in the dataset, this sets a baseline against which more data can be collected in order to build a comprehensive picture of how different factors might be affecting population abundance, and therefore biodiversity, in estuarine systems around the world.
See the full technical report below
LPI for Global Estuarine Systems (0.69 MB)
Collaborators
The development of the Living Planet Index for Global Estuarine Systems was a collaboration between the Zoological Society of London and WWF Netherlands.


